A historically producing Nevada silver district with 36 Moz AgEq, five generations of operator validation, and emerging evidence of district-scale discovery potential. One of the tightest share structures in the silver space.
36 Moz
Historic AgEq Resource
5 Moz
Silver Produced
22,700
Acres — District Scale
~23M
Shares Outstanding
5 Operators
Validated System
Borax, Santa Fe, Newmont, Renaissance, Liberty. Five generations investing in the same system.
364 Holes
Massive Drill Database
Extensive historical drilling provides foundation for modern reinterpretation and targeting.
If this deposit is so good, why wasn't it built? The answer is straightforward.
$3.50/oz
Silver Price Collapsed
Production stopped in 1989 when silver cratered. The geology didn't fail. The economics did.
Oxide Only
Operators Focused on the Shallow Zone
Historic operators targeted oxide heap-leach material. Sulphide zones were never seriously pursued at prior metal prices.
Uneconomic
Sulphides Didn't Work at Old Prices
Deeper sulphide mineralization required different processing and higher silver to justify. That environment didn't exist until now.
No Modern Tools
Lacked Current Modeling
Historic operators had no 3D modeling, no AI-assisted structural analysis, no modern geophysical integration.
Fragmented
Land Was Divided
Multiple claim holders and operators created fragmentation. Americore has now consolidated the entire district under one operator.
2026 Reality
Modern Silver Market Is Different
Silver deficits, solar demand, electrification, critical minerals policy. The market is structurally different from the 1980s.
03 — Why Now
The Timing Advantage
Converging macro factors and project-specific catalysts create a compelling re-entry window.
Silver price ~2.5x higher than the development era. Economics that failed at $3.50/oz work at $30+/oz.
Structural silver deficit — global demand exceeding mine supply for the 4th consecutive year.
Solar and electrification demand consuming record volumes of industrial silver annually.
Shrinking silver inventories — COMEX and LBMA warehouse stocks at multi-year lows.
U.S. domestic supply gap — America imports over 70% of its silver. Critical minerals policy increasingly favors domestic sources.
Quality Nevada silver assets are scarce. Most development-stage silver projects are in less favorable jurisdictions.
Silver Deficit
The Silver Institute projects a 4th consecutive annual deficit. Solar PV alone consumed 194 Moz in 2023, up 64% vs 2020. Supply cannot keep pace with industrial demand growth.
Sulphides Now Economic
At current prices, the economic envelope expands materially. Deeper sulphide zones and structural targets that were sub-economic in the 1980s now warrant serious evaluation.
03b — Market Fundamentals
Silver Supply & Demand: Structural Deficit
Six consecutive years of deficit. Cumulative drawdown of 762 Moz from above-ground stocks since 2021.
1,004
1,114
2021-110 Moz
1,005
1,202
2022-197 Moz
1,012
1,167
2023-155 Moz
1,030
1,145
2024-115 Moz
1,044
1,085
2025-40 Moz
~1,040
~1,130
2026F-46 Moz
Total Supply (Moz) Total Demand (Moz)
762 Moz
Cumulative Drawdown
Above-ground stocks depleted since 2021. Physical supply increasingly constrained.
6th Year
Consecutive Deficit
2026 marks the sixth straight year demand exceeds supply. Structural, not cyclical.
Solar + EV
Industrial Demand Surge
Solar PV consumed 194 Moz in 2023 (up 64% vs 2020). Electrification is accelerating.
Source: The Silver Institute / Metals Focus — World Silver Survey 2026
04 — Discovery Thesis
Why We Believe Trinity Has District-Scale Discovery Potential
This is not just resource validation. Multiple lines of evidence suggest significant discovery upside.
Structural Corridors
NE-trending fault zones provide clear structural controls on mineralization. Where structures intersect, grades intensify.
1.6-Mile Alteration
The alteration footprint extends far beyond the historic pit, indicating a much larger mineralizing system than previously modeled.
Untested Anomalies
Multiple geophysical and geochemical anomalies remain undrilled. Magnetic signatures correlate with the highest assay values.
Geochemical Zoning
Silver-lead-zinc zoning patterns suggest a classical epithermal environment with vertical zonation typical of larger systems.
Intrusive Relationship
Evidence of intrusive bodies driving hydrothermal fluid migration. This is the engine that creates large silver systems.
High-Grade Shoots
570 g/t Ag intercepts and 1,690 g/t grab samples demonstrate high-grade potential at structural intersections.
05 — System Model
The Trinity System Model
Not an old low-grade pit. An evolving district-scale silver system with multiple horizons of value.
Near Surface
Oxide Cap
Bulk tonnage. Heap leach proven. This is what was mined.
Transition
Structural Controls
NE fault zones. Grade increases at intersections.
At Depth
Sulphide Zone
Higher-grade. Flotation viable at current prices.
Deep
Feeder Structures
Vein-style Ag. Discovery upside. The valuation changer.
Untested
Conceptual Targets
Geophysical anomalies. Open in all directions.
06 — Exploration Upside
Open in All Directions
The mineralized system extends beyond the historic pit in every direction. Untested ground remains on all sides.
Open North
Alteration extends 800m+ beyond last drill hole
Historic Pit
36 Moz AgEq
364 holes drilled
Open South
Magnetic anomalies undrilled along strike
Open Northeast
Structural corridor with highest-grade surface samples
Open at Depth
Feeder structures traced but not fully tested below 200m
07 — Key Intercepts
Evidence of Higher-Grade Zones
Structurally controlled mineralization northeast and beneath the historic pit.
Key Drill Intercept
94m @ 111 g/t
Silver
Wide, high-grade intercept demonstrating bulk potential in structural zones
High-Grade Intercept
570 g/t
Silver
Narrow high-grade shoot within feeder structure
Peak Grab Sample
1,690 g/t
Silver
Surface structural zone within claim package
Peak Gold
4.33 g/t
Au
Polymetallic credits across multiple zones
Peak Lead
9.2%
Pb
Robust polymetallic system indicator
Mined Grade
~6 oz/t
Ag
Consistent grade across 1.1M tons processed
Grab samples are selective and may not be representative. Historical drill intercepts from prior operator reports. True widths may vary.
08 — De-Risking
Technically Derisked Relative to Typical Silver Explorers
Most exploration companies have none of this. Americore starts with decades of validation.
✓
Historical production — 5 Moz Ag produced at commercial scale
✓
Heap leach recoveries — proven at commercial scale by Borax
Consolidated ownership — all claims under single operator
09 — Past Producer
5 Moz Silver
Historically Produced
A proven system with real production history. Not an exploration concept.
1982
Discovery by Borax
1987
Heap leach production begins
1989
5 Moz produced. Silver price collapse halts ops.
2026
Americore: modern reinterpretation
1.1M Tons
Material Mined
Heap leach processed 1.1M tons at ~6 oz/t Ag.
Prices, Not Geology
Why It Stopped
Silver crashed. The system stayed open in all directions.
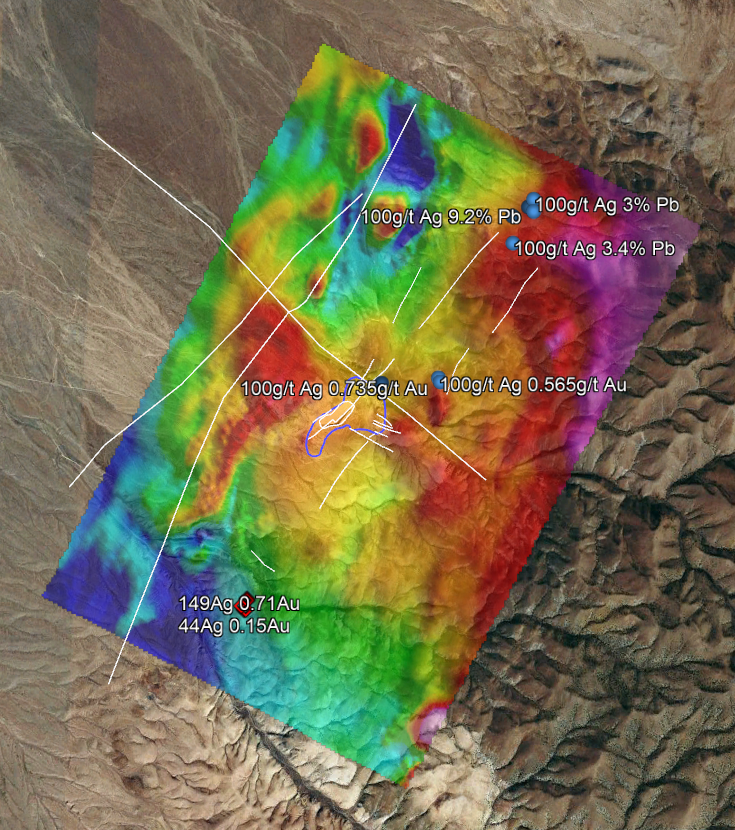
10 — Geophysics
RTP Magnetics
Regional Samples with RTP Magnetics
Magnetic anomalies correlate with highest assay values, indicating structural controls on mineralization that extend at depth. Multiple anomalies remain untested by drilling.
100 g/t Ag
+ 9.2% Lead
0.735 g/t Au
Gold in Structure
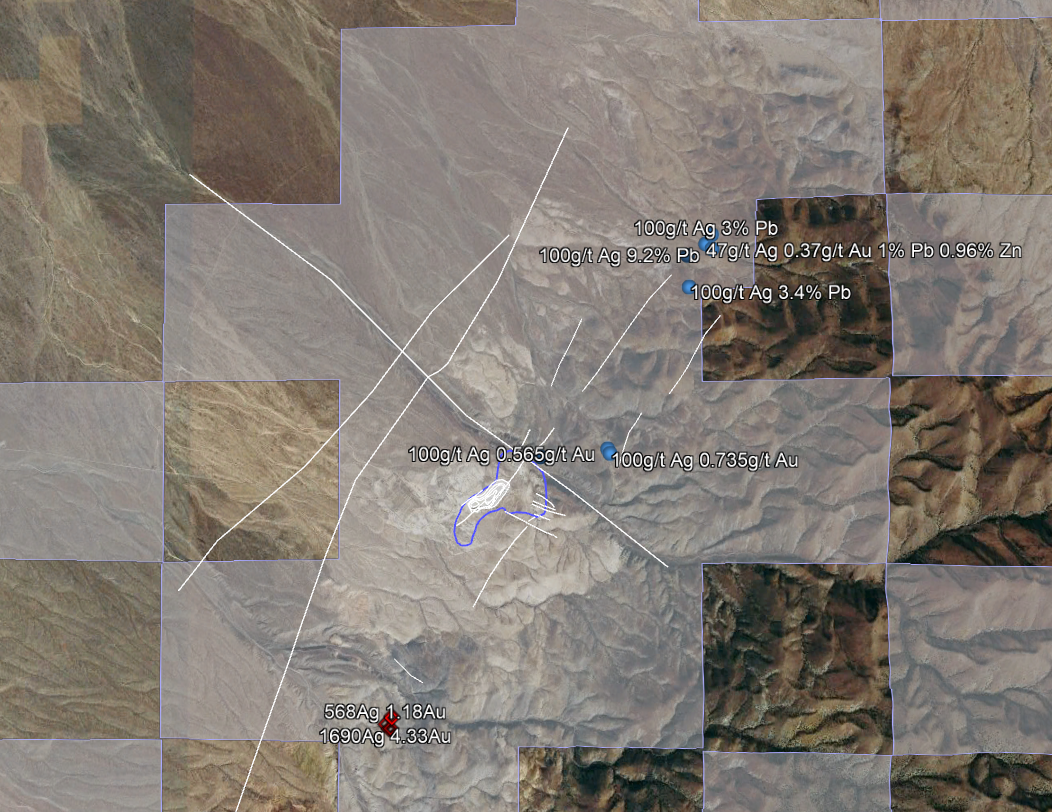
11 — Structural Geology
Fault Structures
Fault Network & Structural Controls
Fault intersections are prime targets for high-grade ore shoots. Multiple converging structures create a favorable setting with significant untested potential.
1.6-mile alteration halo extends well beyond the historic pit, indicating a large mineralizing system.
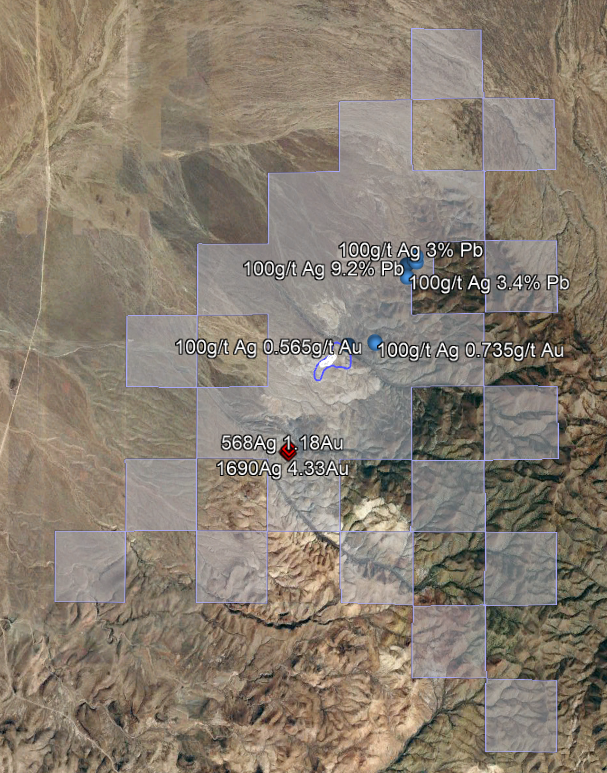
12 — Claim Package
Claims Map
Consolidated District Position
Americore controls all claims covering the historic Liberty Silver resource. Newmont claims, Primus claims, and Nevada Hills agreement consolidated under a single operator.
364
Drill Holes
22,700 ac
District Scale
13 — AI-Assisted Modeling
AI-Assisted Structural Modeling
Practical application of modern computational tools to a rich historical dataset.
Digitizing History
364 Drill Holes Digitized
Comprehensive digitization of all historical drilling, assay data, and geological logs into a modern 3D database.
Vectoring
Targeting Feeder Structures
Machine learning models trained on known high-grade intercepts to vector toward untested structural intersections and feeder zones.
Integration
Multi-Dataset Synthesis
Integrating geophysics (magnetics, gravity), geology (mapping, logging), and drilling (assays, lithology) into unified structural models.
14 — Metallurgy
Proven Metallurgy
Three processing pathways. Three independent testing organizations. Decades of validation.
Heap Leach
Commercially proven by Borax. 5 Moz produced via cyanide heap leaching of oxide material.
Oxide Cyanidation
Conventional cyanide leaching. Processing pathway well understood and commercially validated.
Sulphide Flotation
Deeper sulphide material amenable to flotation. Provides pathway for higher-grade structural zones.
Tested By
Borax (commercial), Hazen Research (lab), KCA Metallurgical (lab). Independent confirmation from three organizations.
15 — Relative Valuation
EV/Oz Relative Valuation
Americore's enterprise value per silver-equivalent ounce versus comparable development-stage silver companies.
Americore Resources
$0.18
Viscount Mining
$0.42
Blackrock Silver
$0.78
Dolly Varden Silver
$1.02
Discovery Silver
$1.28
EV/oz AgEq based on estimated enterprise values and reported/historical resources. Illustrative comparison using publicly available data. Subject to resource classification and methodology differences.
16 — Capital Structure
~23M Shares
Outstanding
One of the tightest structures in the silver exploration space. Maximum leverage to silver price and drill results.
~23M
Basic Outstanding
$0 Debt
Clean Balance Sheet
2% NSR
Royalty to Newmont
Option to buy 50% for $3.5M pre-production
Tight Float
Insider Ownership
Significant insider holdings align management with shareholders
Newmont Agreement: USD $50K + 100K shares (effective). $100K + 300K shares (Year 1). $350K + 700K shares for full title. Royalty buyback option at $3.5M.
17 — Nevada, USA
Premier Mining Jurisdiction
Pershing County, Nevada. Near Lovelock, I-80 corridor, Rochester Mine.
I-80 Highway Access
Major highway corridor with established road access to site.
Near Lovelock
Workforce, services, supply chain access nearby.
Rochester Mine
Coeur's Rochester Mine operates in the same region, confirming district viability.
Nevada Advantage
No state income tax. Established permitting. Deep mining workforce. Consistently ranked #1 mining jurisdiction globally.
Rail & Infrastructure
Nearby rail. Existing roads. Grid power accessible. Water rights available.
18 — Development Path
Clear Path Forward
Systematic advancement leveraging the extensive historical database.
Phase 1
Data & Modeling
Compile 364-hole drill database
Digitize geological logs
AI-assisted structural modeling
Target generation
Phase 2
Verification
Twin-hole drilling program
Verify key intercepts
Modern assay protocols
Updated metallurgical testing
Phase 3
Discovery
Test structural targets
Explore feeder zones at depth
Step-out drilling
Expand resource envelope
Phase 4
Resource Update
NI 43-101 resource estimate
Preliminary economic assessment
Updated mine plan
Advancement decision
19 — Investment Thesis
Americore Resources
THE TRINITY SILVER PROJECT
A historically producing Nevada silver district with a 36 Moz AgEq resource, district-scale discovery potential, and the tightest share structure in the silver exploration space. Five operators. Proven metallurgy. AI-assisted structural modeling revealing untested high-grade targets. Open in all directions. Technically derisked. Re-entering the market at the right moment in the silver cycle.
This presentation contains forward-looking statements and historical data. Historical resources and production figures are referenced for informational purposes and may not be NI 43-101 compliant. Grab samples are selective and may not be representative. EV/oz comparisons are illustrative and based on publicly available data. Investors should review the 2025 Technical Report by Respec for complete technical details. This is not an offer to sell securities.